


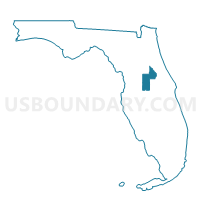
Clermont CCD, Lake County, Florida
About
Outline

Summary
| Unique Area Identifier | 125001 |
| Name | Clermont CCD |
| County | Lake County |
| State | Florida |
| Area (square miles) | 195.84 |
| Land Area (square miles) | 157.74 |
| Water Area (square miles) | 38.10 |
| % of Land Area | 80.55 |
| % of Water Area | 19.45 |
| Latitude of the Internal Point | 28.50149320 |
| Longtitude of the Internal Point | -81.73536900 |
| Total Population | 78,848 |
| Total Housing Units | 33,914 |
| Total Households | 28,647 |
| Median Age | 38.7 |
Maps

Graphs
Select a template below for downloading or customizing gragh for Clermont CCD, Lake County, Florida


Neighbors
Neighoring County Subdivision (by Name) Neighboring County Subdivision on the Map
- Apopka CCD, Orange County, FL
- Groveland-Mascotte CCD, Lake County, FL
- Haines City CCD, Polk County, FL
- Howey-in-the-Hills-Okahumpka CCD, Lake County, FL
- Kissimmee CCD, Osceola County, FL
- Lakeland CCD, Polk County, FL
- Southwest Orange CCD, Orange County, FL
- Tavares CCD, Lake County, FL
- Winter Garden-Ocoee CCD, Orange County, FL
Top 10 Neighboring Place (by Population) Neighboring Place on the Map
- Winter Garden city, FL (34,568)
- Clermont city, FL (28,742)
- Four Corners CDP, FL (26,116)
- Horizon West CDP, FL (14,000)
- Minneola city, FL (9,403)
- Groveland city, FL (8,729)
- Oakland town, FL (2,538)
- Astatula town, FL (1,810)
- Montverde town, FL (1,463)
- Ferndale CDP, FL (472)
Top 10 Neighboring Unified School District (by Population) Neighboring Unified School District on the Map
- Orange County School District, FL (1,145,956)
- Polk County School District, FL (602,095)
- Lake County School District, FL (297,052)
- Osceola County School District, FL (268,685)
Top 10 Neighboring State Legislative District Lower Chamber (by Population) Neighboring State Legislative District Lower Chamber on the Map
- State House District 41, FL (252,332)
- State House District 42, FL (214,866)
- State House District 25, FL (179,031)
- State House District 64, FL (165,492)
- State House District 38, FL (162,248)
Top 10 Neighboring State Legislative District Upper Chamber (by Population) Neighboring State Legislative District Upper Chamber on the Map
- State Senate District 20, FL (576,207)
- State Senate District 15, FL (560,770)
- State Senate District 9, FL (527,435)
Top 10 Neighboring 111th Congressional District (by Population) Neighboring 111th Congressional District on the Map
- Congressional District 5, FL (929,533)
- Congressional District 15, FL (813,570)
- Congressional District 8, FL (805,608)
Top 10 Neighboring Census Tract (by Population) Neighboring Census Tract on the Map
- Census Tract 171.04, Orange County, FL (22,670)
- Census Tract 313.07, Lake County, FL (17,784)
- Census Tract 313.10, Lake County, FL (14,586)
- Census Tract 313.11, Lake County, FL (13,462)
- Census Tract 312.04, Lake County, FL (12,444)
- Census Tract 171.05, Orange County, FL (12,286)
- Census Tract 171.03, Orange County, FL (11,629)
- Census Tract 124.03, Polk County, FL (9,921)
- Census Tract 313.09, Lake County, FL (9,259)
- Census Tract 310, Lake County, FL (7,551)
Top 10 Neighboring 5-Digit ZIP Code Tabulation Area (by Population) Neighboring 5-Digit ZIP Code Tabulation Area on the Map
- 34711, FL (51,847)
- 34787, FL (46,083)
- 32757, FL (23,746)
- 34715, FL (15,455)
- 34714, FL (14,685)
- 33897, FL (14,117)
- 34736, FL (13,961)
- 34747, FL (13,692)
- 33868, FL (11,720)
- 34756, FL (3,006)
Data
Demographic, Population, Households, and Housing Units
** Data sources from census 2010 **
Show Data on Map
Download Full List as CSV
Download Quick Sheet as CSV
| Subject | This Area | Lake County | Florida | National |
|---|---|---|---|---|
| POPULATION | ||||
| Total Population Map | 78,848 | 297,052 | 18,801,310 | 308,745,538 |
| POPULATION, HISPANIC OR LATINO ORIGIN | ||||
| Not Hispanic or Latino Map | 63,467 | 261,043 | 14,577,504 | 258,267,944 |
| Hispanic or Latino Map | 15,381 | 36,009 | 4,223,806 | 50,477,594 |
| POPULATION, RACE | ||||
| White alone Map | 60,773 | 243,624 | 14,109,162 | 223,553,265 |
| Black or African American alone Map | 8,295 | 29,103 | 2,999,862 | 38,929,319 |
| American Indian and Alaska Native alone Map | 362 | 1,472 | 71,458 | 2,932,248 |
| Asian alone Map | 2,450 | 5,173 | 454,821 | 14,674,252 |
| Native Hawaiian and Other Pacific Islander alone Map | 80 | 215 | 12,286 | 540,013 |
| Some Other Race alone Map | 4,215 | 10,778 | 681,144 | 19,107,368 |
| Two or More Races Map | 2,673 | 6,687 | 472,577 | 9,009,073 |
| POPULATION, SEX | ||||
| Male Map | 38,172 | 143,937 | 9,189,355 | 151,781,326 |
| Female Map | 40,676 | 153,115 | 9,611,955 | 156,964,212 |
| POPULATION, AGE (18 YEARS) | ||||
| 18 years and over Map | 58,552 | 235,311 | 14,799,219 | 234,564,071 |
| Under 18 years | 20,296 | 61,741 | 4,002,091 | 74,181,467 |
| POPULATION, AGE | ||||
| Under 5 years | 4,940 | 16,233 | 1,073,506 | 20,201,362 |
| 5 to 9 years | 5,795 | 17,115 | 1,080,255 | 20,348,657 |
| 10 to 14 years | 6,096 | 17,575 | 1,130,847 | 20,677,194 |
| 15 to 17 years | 3,465 | 10,818 | 717,483 | 12,954,254 |
| 18 and 19 years | 2,020 | 6,406 | 510,899 | 9,086,089 |
| 20 years | 847 | 2,890 | 258,030 | 4,519,129 |
| 21 years | 833 | 2,661 | 248,602 | 4,354,294 |
| 22 to 24 years | 2,366 | 7,948 | 722,126 | 12,712,576 |
| 25 to 29 years | 4,192 | 14,268 | 1,179,227 | 21,101,849 |
| 30 to 34 years | 4,723 | 14,644 | 1,110,318 | 19,962,099 |
| 35 to 39 years | 5,849 | 16,841 | 1,178,467 | 20,179,642 |
| 40 to 44 years | 6,351 | 18,465 | 1,252,787 | 20,890,964 |
| 45 to 49 years | 6,430 | 20,321 | 1,401,202 | 22,708,591 |
| 50 to 54 years | 5,342 | 19,430 | 1,340,291 | 22,298,125 |
| 55 to 59 years | 4,498 | 18,640 | 1,202,418 | 19,664,805 |
| 60 and 61 years | 1,918 | 7,987 | 458,751 | 7,113,727 |
| 62 to 64 years | 2,726 | 12,985 | 676,499 | 9,704,197 |
| 65 and 66 years | 1,560 | 8,421 | 397,917 | 5,319,902 |
| 67 to 69 years | 2,266 | 12,699 | 561,316 | 7,115,361 |
| 70 to 74 years | 2,712 | 17,992 | 768,707 | 9,278,166 |
| 75 to 79 years | 1,810 | 14,102 | 615,514 | 7,317,795 |
| 80 to 84 years | 1,217 | 10,228 | 482,023 | 5,743,327 |
| 85 years and over | 892 | 8,383 | 434,125 | 5,493,433 |
| MEDIAN AGE BY SEX | ||||
| Both sexes Map | 38.70 | 45.60 | 40.70 | 37.20 |
| Male Map | 38.20 | 44.40 | 39.40 | 35.80 |
| Female Map | 39.10 | 46.90 | 42.10 | 38.50 |
| HOUSEHOLDS | ||||
| Total Households Map | 28,647 | 121,289 | 7,420,802 | 116,716,292 |
| HOUSEHOLDS, HOUSEHOLD TYPE | ||||
| Family households: Map | 21,762 | 83,792 | 4,835,475 | 77,538,296 |
| Husband-wife family Map | 17,224 | 65,983 | 3,457,149 | 56,510,377 |
| Other family: Map | 4,538 | 17,809 | 1,378,326 | 21,027,919 |
| Male householder, no wife present Map | 1,238 | 4,928 | 373,284 | 5,777,570 |
| Female householder, no husband present Map | 3,300 | 12,881 | 1,005,042 | 15,250,349 |
| Nonfamily households: Map | 6,885 | 37,497 | 2,585,327 | 39,177,996 |
| Householder living alone Map | 5,296 | 30,579 | 2,021,781 | 31,204,909 |
| Householder not living alone Map | 1,589 | 6,918 | 563,546 | 7,973,087 |
| HOUSEHOLDS, HISPANIC OR LATINO ORIGIN OF HOUSEHOLDER | ||||
| Not Hispanic or Latino householder: Map | 24,050 | 111,147 | 6,087,554 | 103,254,926 |
| Hispanic or Latino householder: Map | 4,597 | 10,142 | 1,333,248 | 13,461,366 |
| HOUSEHOLDS, RACE OF HOUSEHOLDER | ||||
| Householder who is White alone | 23,154 | 104,917 | 5,918,746 | 89,754,352 |
| Householder who is Black or African American alone | 2,770 | 9,723 | 1,005,589 | 14,129,983 |
| Householder who is American Indian and Alaska Native alone | 118 | 485 | 25,704 | 939,707 |
| Householder who is Asian alone | 701 | 1,523 | 145,808 | 4,632,164 |
| Householder who is Native Hawaiian and Other Pacific Islander alone | 17 | 56 | 3,858 | 143,932 |
| Householder who is Some Other Race alone | 1,222 | 2,856 | 192,042 | 4,916,427 |
| Householder who is Two or More Races | 665 | 1,729 | 129,055 | 2,199,727 |
| HOUSEHOLDS, HOUSEHOLD TYPE BY HOUSEHOLD SIZE | ||||
| Family households: Map | 21,762 | 83,792 | 4,835,475 | 77,538,296 |
| 2-person household Map | 8,929 | 44,744 | 2,183,933 | 31,882,616 |
| 3-person household Map | 4,780 | 15,789 | 1,086,320 | 17,765,829 |
| 4-person household Map | 4,635 | 12,906 | 874,904 | 15,214,075 |
| 5-person household Map | 2,172 | 6,342 | 411,851 | 7,411,997 |
| 6-person household Map | 806 | 2,463 | 165,397 | 3,026,278 |
| 7-or-more-person household Map | 440 | 1,548 | 113,070 | 2,237,501 |
| Nonfamily households: Map | 6,885 | 37,497 | 2,585,327 | 39,177,996 |
| 1-person household Map | 5,296 | 30,579 | 2,021,781 | 31,204,909 |
| 2-person household Map | 1,322 | 5,911 | 459,229 | 6,360,012 |
| 3-person household Map | 178 | 627 | 66,366 | 992,156 |
| 4-person household Map | 61 | 234 | 25,473 | 411,171 |
| 5-person household Map | 16 | 82 | 7,379 | 126,634 |
| 6-person household Map | 10 | 42 | 2,998 | 48,421 |
| 7-or-more-person household Map | 2 | 22 | 2,101 | 34,693 |
| HOUSING UNITS | ||||
| Total Housing Units Map | 33,914 | 144,996 | 8,989,580 | 131,704,730 |
| HOUSING UNITS, OCCUPANCY STATUS | ||||
| Occupied Map | 28,647 | 121,289 | 7,420,802 | 116,716,292 |
| Vacant Map | 5,267 | 23,707 | 1,568,778 | 14,988,438 |
| HOUSING UNITS, OCCUPIED, TENURE | ||||
| Owned with a mortgage or a loan Map | 16,675 | 56,299 | 3,348,864 | 52,979,430 |
| Owned free and clear Map | 4,247 | 36,503 | 1,650,115 | 23,006,644 |
| Renter occupied Map | 7,725 | 28,487 | 2,421,823 | 40,730,218 |
| HOUSING UNITS, VACANT, VACANCY STATUS | ||||
| For rent Map | 1,180 | 5,309 | 371,626 | 4,137,567 |
| Rented, not occupied Map | 41 | 245 | 15,438 | 206,825 |
| For sale only Map | 930 | 4,282 | 198,232 | 1,896,796 |
| Sold, not occupied Map | 140 | 613 | 31,911 | 421,032 |
| For seasonal, recreational, or occasional use Map | 2,068 | 8,804 | 657,070 | 4,649,298 |
| For migrant workers Map | 12 | 23 | 1,541 | 24,161 |
| Other vacant Map | 896 | 4,431 | 292,960 | 3,652,759 |
| HOUSING UNITS, OCCUPIED, AVERAGE HOUSEHOLD SIZE BY TENURE | ||||
| Total: Map | 2.75 | 2.42 | 2.48 | 2.58 |
| Owner occupied Map | 2.74 | 2.37 | 2.47 | 2.65 |
| Renter occupied Map | 2.75 | 2.57 | 2.49 | 2.44 |
| HOUSING UNITS, OCCUPIED, TENURE BY RACE OF HOUSEHOLDER | ||||
| Owner occupied: Map | 20,922 | 92,802 | 4,998,979 | 75,986,074 |
| Householder who is White alone Map | 17,460 | 83,430 | 4,252,583 | 63,446,275 |
| Householder who is Black or African American alone Map | 1,776 | 5,331 | 480,760 | 6,261,464 |
| Householder who is American Indian and Alaska Native alone Map | 71 | 289 | 14,279 | 509,588 |
| Householder who is Asian alone Map | 587 | 1,206 | 98,804 | 2,688,861 |
| Householder who is Native Hawaiian and Other Pacific Islander alone Map | 11 | 28 | 1,917 | 61,911 |
| Householder who is Some Other Race alone Map | 583 | 1,418 | 81,491 | 1,975,817 |
| Householder who is Two or More Races Map | 434 | 1,100 | 69,145 | 1,042,158 |
| Renter occupied: Map | 7,725 | 28,487 | 2,421,823 | 40,730,218 |
| Householder who is White alone Map | 5,694 | 21,487 | 1,666,163 | 26,308,077 |
| Householder who is Black or African American alone Map | 994 | 4,392 | 524,829 | 7,868,519 |
| Householder who is American Indian and Alaska Native alone Map | 47 | 196 | 11,425 | 430,119 |
| Householder who is Asian alone Map | 114 | 317 | 47,004 | 1,943,303 |
| Householder who is Native Hawaiian and Other Pacific Islander alone Map | 6 | 28 | 1,941 | 82,021 |
| Householder who is Some Other Race alone Map | 639 | 1,438 | 110,551 | 2,940,610 |
| Householder who is Two or More Races Map | 231 | 629 | 59,910 | 1,157,569 |
| HOUSING UNITS, OCCUPIED, TENURE BY HISPANIC OR LATINO ORIGIN OF HOUSEHOLDER | ||||
| Owner occupied: Map | 20,922 | 92,802 | 4,998,979 | 75,986,074 |
| Not Hispanic or Latino householder Map | 18,277 | 86,855 | 4,274,313 | 69,617,625 |
| Hispanic or Latino householder Map | 2,645 | 5,947 | 724,666 | 6,368,449 |
| Renter occupied: Map | 7,725 | 28,487 | 2,421,823 | 40,730,218 |
| Not Hispanic or Latino householder Map | 5,773 | 24,292 | 1,813,241 | 33,637,301 |
| Hispanic or Latino householder Map | 1,952 | 4,195 | 608,582 | 7,092,917 |
| HOUSING UNITS, OCCUPIED, TENURE BY HOUSEHOLD SIZE | ||||
| Owner occupied: Map | 20,922 | 92,802 | 4,998,979 | 75,986,074 |
| 1-person household Map | 3,271 | 21,469 | 1,227,080 | 16,453,569 |
| 2-person household Map | 8,257 | 43,133 | 1,975,675 | 27,618,605 |
| 3-person household Map | 3,588 | 11,837 | 750,284 | 12,517,563 |
| 4-person household Map | 3,455 | 9,515 | 605,447 | 10,998,793 |
| 5-person household Map | 1,516 | 4,244 | 268,036 | 5,057,765 |
| 6-person household Map | 552 | 1,628 | 104,017 | 1,965,796 |
| 7-or-more-person household Map | 283 | 976 | 68,440 | 1,373,983 |
| Renter occupied: Map | 7,725 | 28,487 | 2,421,823 | 40,730,218 |
| 1-person household Map | 2,025 | 9,110 | 794,701 | 14,751,340 |
| 2-person household Map | 1,994 | 7,522 | 667,487 | 10,624,023 |
| 3-person household Map | 1,370 | 4,579 | 402,402 | 6,240,422 |
| 4-person household Map | 1,241 | 3,625 | 294,930 | 4,626,453 |
| 5-person household Map | 672 | 2,180 | 151,194 | 2,480,866 |
| 6-person household Map | 264 | 877 | 64,378 | 1,108,903 |
| 7-or-more-person household Map | 159 | 594 | 46,731 | 898,211 |
Loading...